Summary:
- Bitcoin could be gearing up for a rapid drop to $22k or $20k, where macro support lies.
- Bitcoin options data shows that traders are loading up on hedges in the event of another leg down.
- Bitcoin has been struggling to maintain its value above $30k.
- The weekly Bitcoin chart further points to more weakness that could lead to a meltdown to the 200-week moving average around the $22k price area.
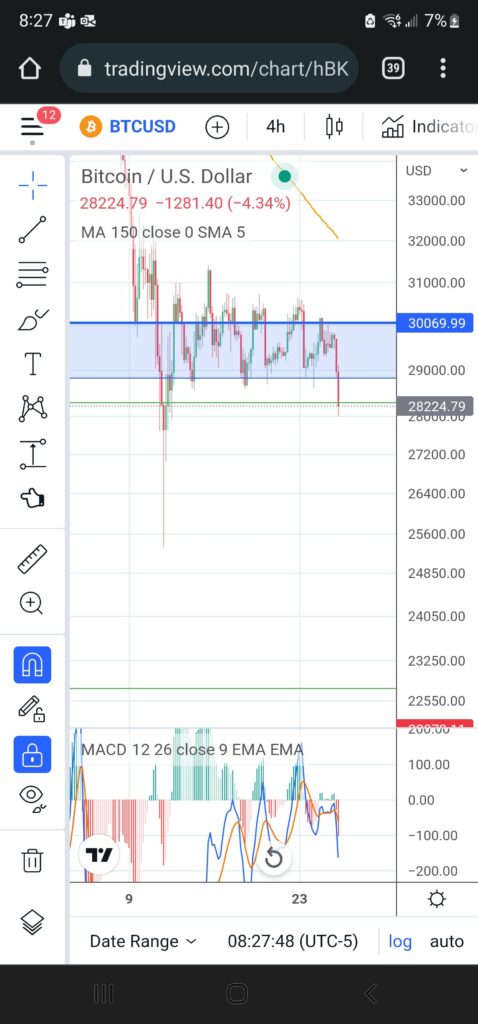
Bitcoin (BTC) could experience a rapid decline to $22k or $20k. This is according to an analysis shared by popular BTC analyst, MagicPoopCannon, who also explained that Bitcoin is currently trading below the 61.8% retracement level of the entire bull market. Magic also pointed out that $22k to $20k was an area of macro support for Bitcoin.
He shared his analysis of the likelihood of a Bitcoin drop to the levels mentioned above through the following statement and accompanying chart.
#BTC is falling below the 61.8% [retrace] of the entire bull market, in what may be the beginning of the next major leg lower. I do see a technical case for a rapid decline to $22,000 or $20,000, before new support is found, if a leg down gains steam

Bitcoin Options Data Suggests Investors are Anticipating Another Leg Down
Similarly, an analysis by the team at Bloomberg concluded that Bitcoin options data suggests that investors are anticipating another leg down for BTC. According to their research, the put-to-call ratio of BTC has hit a one-year high of 0.72, meaning Bitcoin traders are loading up on hedges in the event of another dip to lower levels.
Josh Olszewicz, head of research at Valkyrie Investments, further explained that the global financial macro environment was another reason investors were bearish on Bitcoin. He said:
[It] signals cynicism in the markets with rising bearish sentiment…Given the macro situation globally, and the near uniform risk-off trade currently dominating most asset classes, traders have followed suit with their Bitcoin strategies.
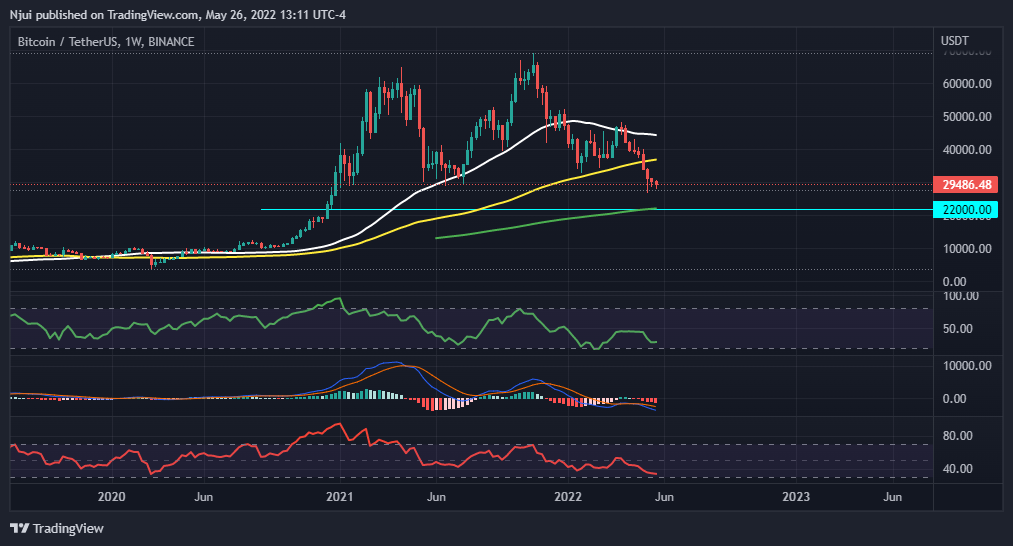
Bitcoin’s Weekly Chart Confirms the Possibility of a Drop to the 200-week MA at Around $22k
Further consulting the weekly Bitcoin chart below, it can be deduced that BTC is in a clear downtrend and looks set to retest the 200-week moving average (green) in the days ahead. The latter moving average also coincides with one of Magic’s targets of $22k.


