intermediate
Learning how to identify and use the bull flag pattern is essential for anyone looking to up their trading game. It allows you to spot a continuation of positive price action, which, in turn, lets you make a lot of profit.
However, patterns like bull flags are great not only for making a profit but also for gaining a better understanding of the market as a whole. In this article, we will discuss what the bull flag patterns are, how to identify them, and how to trade with them. Let’s go!
What Is a Bull Flag Pattern?
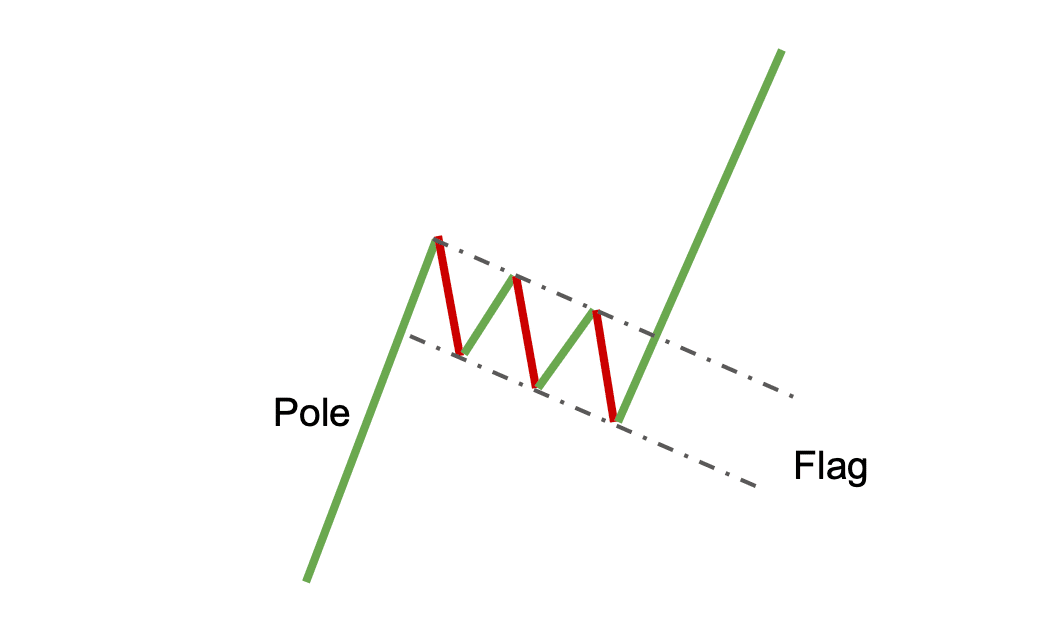
A bull flag is a chart pattern often used in technical analysis and trading to identify a bullish continuation. It occurs when a stock or other security trades in a sideways range after an advance and then breaks out above the resistance level, creating a strong uptrend.
To put it simply, a bull flag pattern signals that although there may be a temporary setback, a positive price trend is likely to continue.
The bullish flag pattern is the direct opposite of the bear flag. While the former shows a continuation of positive price movement, the bearish flag pattern signals the approach of a downtrend. Bear flags have the same structure as bull flags — the flagpole and the flag itself — but are inverted. Read more about them here.
Wanna see more content like this? Subscribe to Changelly’s newsletter to get weekly crypto news round-ups, price predictions, and information on the latest trends directly in your inbox!
Stay on top of crypto trends
Subscribe to our newsletter to get the latest crypto news in your inbox
How to Identify Bull Flag Patterns
The first step in identifying the bullish flag pattern is to recognize an upward trend (i.e., the flagpole).
In order for it to be a bullish flag pattern, this flagpole has to be followed by the flag — a downward sloping consolidation period. It is usually made up of smaller back-and-forth price moves with continuously lower highs.
After a period of consolidation, traders will look for a breakout above the previous highs. This signals that the upward trend continues and that traders can enter long positions.

It may seem that one can identify flag chart patterns without breaking a sweat, but they are actually quite tricky. Pay close attention to all the signals and try to wait for the confirmation of the bullish trend before making any trading decisions if you’re not an experienced trader yet.
Example
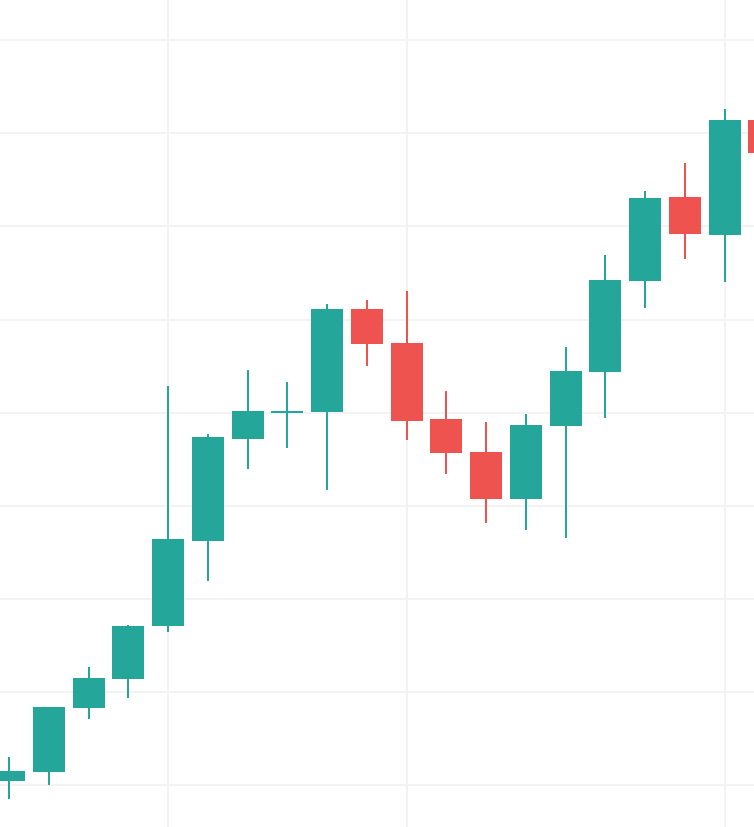
Here’s an example of a simple bull flag chart continuation pattern.

It is a fragment of the BTCUSD price chart from the beginning of August 2021. It shows a clear flagpole, a flag, and the following uptrend. The price consolidated for a short while but managed to begin rising again, completing the bull flag pattern.
Bull Flag vs Flat Top Breakout
One common question traders have is whether the bull flag pattern is the same as the flat top breakout. The answer to this question is no, they are not the same. While both patterns can signal bullish continuation, the key difference between them is that the bull flag has lower highs, while the flat top breakout has equal highs.
How to Trade a Bull Flag Chart Pattern
Now that we have discussed the nature of the bull flag pattern and ways to identify it, let’s talk about how we can trade it. There are two principal ways to trade the bull flag pattern: buying the breakout or buying the pullback.
Buying the breakout means that traders will enter long positions when the price breaks out above the resistance level. A stop-loss order should be placed below the consolidation level to protect against a false breakout.
Buying the pullback means that traders will enter long positions when the price retraces and tests the previous highs. A stop-loss order should be placed below the lows of the pullback to protect against a further decline.
Here are some extra tips for trading bull flag patterns:
- It is crucial to wait for a clear breakout before entering a trade. A false breakout can lead to losses.
- Place a stop-loss order below the consolidation level or the lows of the pullback. This will help to protect against a decline.
- Take profits when the price reaches the measured move target. This is the minimum price objective for the pattern, and it can be calculated by measuring the height of the flagpole and adding it to the breakout point.
Pros and Cons of Bull Flag Patterns
Like all chart patterns, the bull flag has its pros and cons.
Pros:
- The bull flag can signal a continuation of an uptrend.
- It provides clear price targets.
- One can easily identify this pattern.
Cons:
- False breakouts can occur.
- It requires patience to wait for a clear breakout.
To minimize the chance of losing money to a false breakout, make use of tools such as trading indicators and try to be patient.
In most cases, it would be better to wait for clearly manifested signals than going all in at the first sign of a continuation pattern. Yes, you might lose out on some additional profit, but at least you’ll minimize the risk of losing your initial investment. Don’t fall for FOMO, do your own research, and study the market to maximize your profit while trading. Good luck!
Disclaimer: Please note that the contents of this article are not financial or investing advice. The information provided in this article is the author’s opinion only and should not be considered as offering trading or investing recommendations. We do not make any warranties about the completeness, reliability and accuracy of this information. The cryptocurrency market suffers from high volatility and occasional arbitrary movements. Any investor, trader, or regular crypto users should research multiple viewpoints and be familiar with all local regulations before committing to an investment.

