intermediate
No matter whether you are a beginner or an expert investor, one of your biggest priorities in trading will likely be finding the correct entry and exit points. Although plenty of tools can help you with that, overbought and oversold levels are widely considered among the best ones. These signals are an essential part of technical analysis and can be easily used to identify key buying and selling opportunities.
In this article, we will discuss what overbought and oversold conditions and signals mean and will look at some ways to recognize them. We will also provide examples of how you can use these signals to your advantage in the market!
Wanna see more content like this? Subscribe to Changelly’s newsletter to get weekly crypto news round-ups, price predictions, and information on the latest trends directly in your inbox!
Stay on top of crypto trends
Subscribe to our newsletter to get the latest crypto news in your inbox
What Are Overbought and Oversold Signals?
Overbought and oversold signals are technical indicators used to identify when a security becomes too expensive or too cheap. One can apply these signals to gain more insight when deciding on buying or selling a security.
How Do They Work?
Overbought and oversold signals work by comparing the current price of a security to its past prices. Despite being named “signals,” they are not actual alarms — they just show you that there is a certain price pattern in the market. When they appear, it means you should pay closer attention to the market and other indicators as there is a possibility that a rally or a massive sell-off is coming up.

Overbought Signals
An overbought signal occurs when the current price is much higher than the past prices. This usually happens when there is a lot of buying pressure in the market, and the price of the security goes up very quickly.
Oversold Signals
An oversold signal occurs when the current price is much lower than the past prices. This typically occurs when there is a lot of selling pressure in the market, with the price of an asset rapidly declining.
How to Identify Overbought and Oversold Signals
There are many different ways to identify overbought and oversold signals. Some of the most popular methods include technical indicators, such as the Relative Strength Index (RSI) or the Stochastic Oscillator.
If you don’t want to use trading interfaces or anything like that, you can use one of the many available websites that determine whether an asset is oversold or overbought. They will show you a ready-to-use rating that will reflect the current overall market trend for that asset. Most of these readings are calculated automatically, but you should still be cautious and not fully trust them.
Overbought Signals
As we mentioned earlier, overbought signals occur when the current price is much higher than the past prices. It typically follows a long and intense rally.
Keeping an eye on a digital asset’s price action can also be a good way to identify overbought signals promptly. For example, if the price of a security is moving up very quickly and then starts to consolidate, this could be an indication that it is overbought. Additionally, overbought prices usually have a hard time crossing over the resistance line.
Oversold Signals
An oversold signal occurs when the current price is much lower than the past prices. It is a direct result of too much selling pressure existing in the market, which leads to a long period of asset price decline.
Another way to identify whether it is an overbought or oversold market (or neither) is to pay attention to price movements. If the price of an asset is moving down very quickly and then starts to consolidate, this could be an indication that it is oversold.
You can also try to identify oversold market conditions using support and resistance levels. Oversold assets typically don’t go below the support line.
Overbought and Oversold Indicators
There are various overbought and oversold indicators out there that could help you in picking a moment to buy or sell a security. Some of the most popular indicators include the Relative Strength Index (RSI), the Stochastic Oscillator, and the Williams %R.
RSI
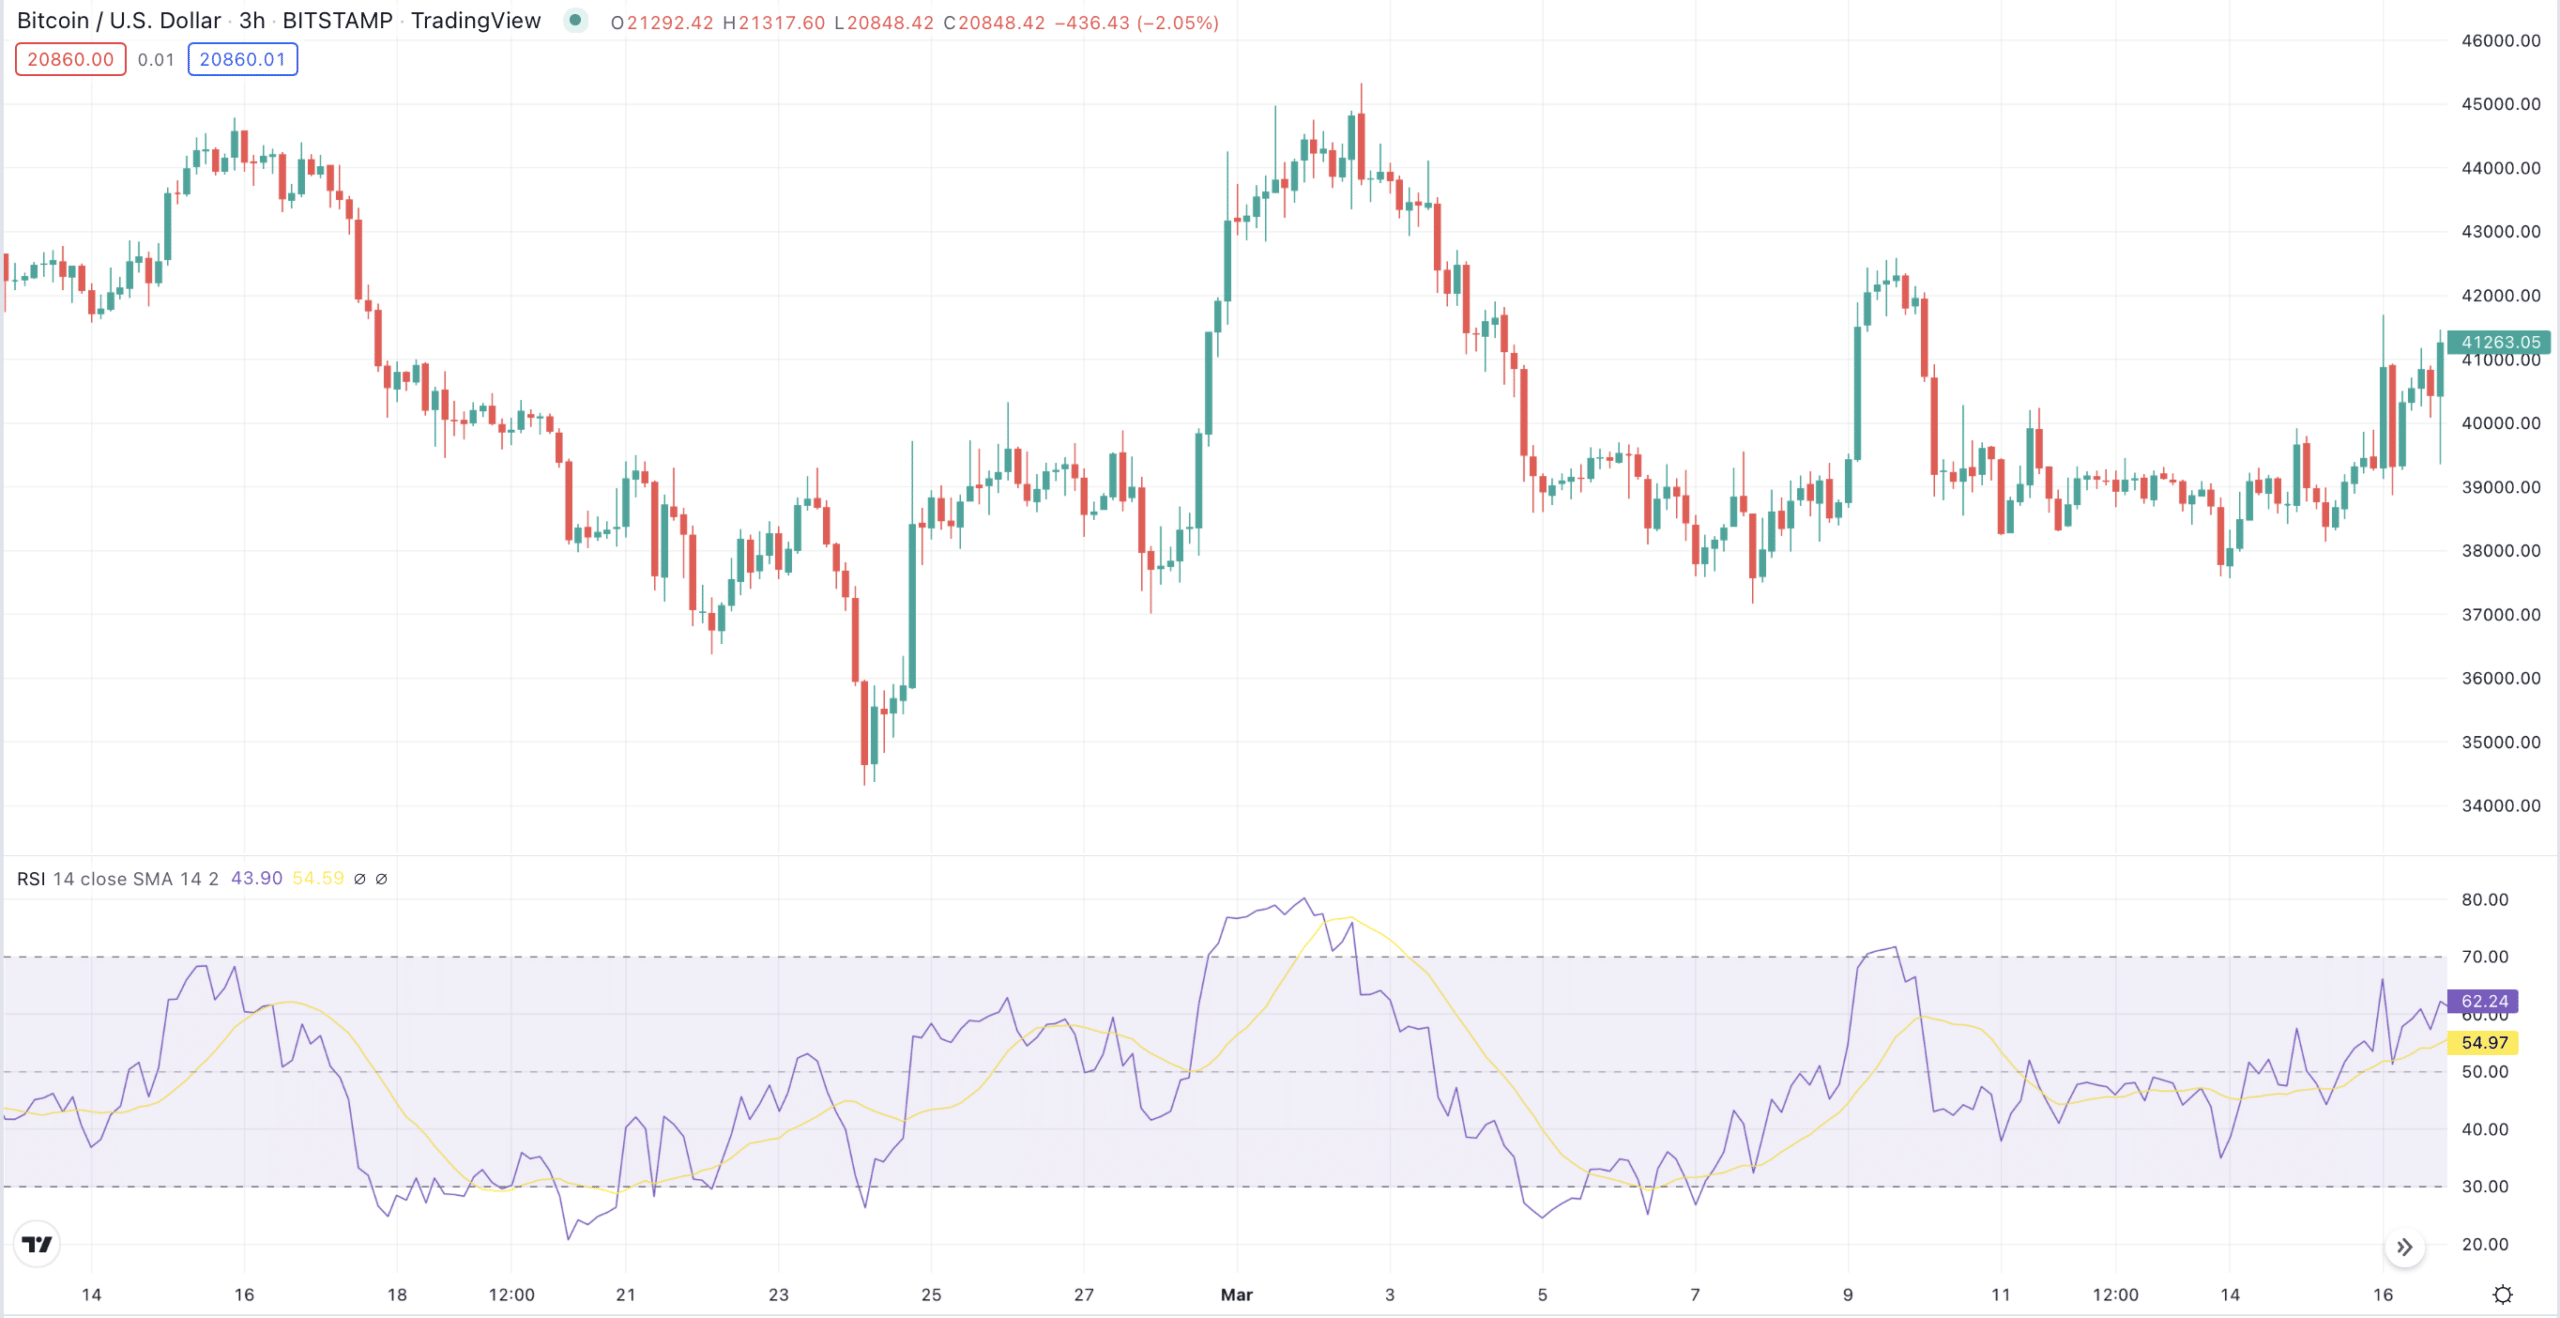
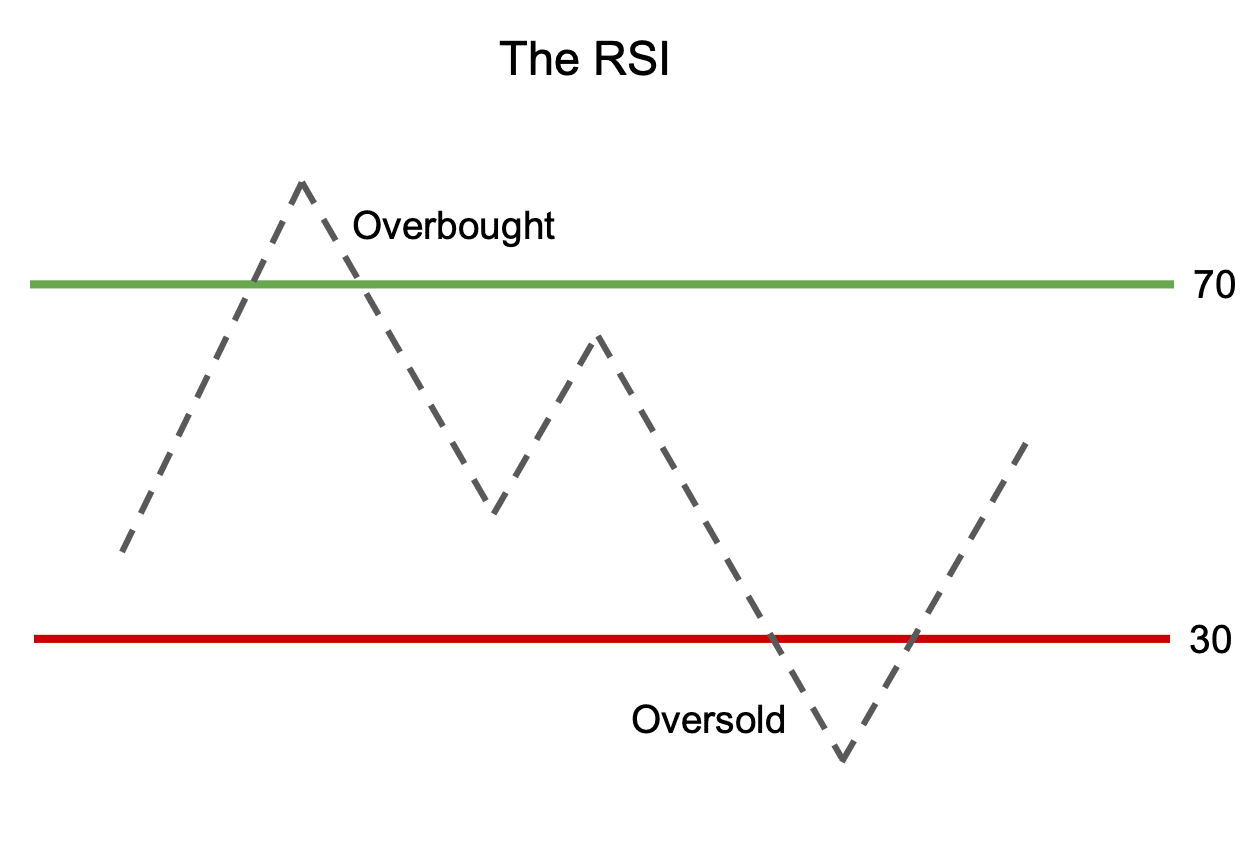
The Relative Strength Index (RSI) is a popular overbought and oversold indicator. It measures the strength of the current price relative to past prices. If the RSI is above 70, it is said to be overbought. If the RSI is below 30, it is said to be oversold. Although you can calculate the RSI yourself, it is integrated into almost all trading platforms — just enable it in the tool settings.

RSI vs. MACD
The MACD (Moving Average Convergence Divergence) line is another popular overbought and oversold indicator. It measures the difference between two moving averages. If the MACD is above 0, it is said to be overbought. If the MACD is below 0, it is said to be oversold.
MACD is generally considered to be less reliable than the RSI. The latter gives fewer but stronger signals and is reliable even outside of trending markets, unlike the MACD.
MACD has some areas where it can outperform the RSI; however, it is typically advised against applying it in crypto markets.
Stochastic Oscillator
The Stochastic Oscillator is another popular overbought and oversold indicator. It measures the current price relative to past prices. If the Stochastic Oscillator is above 80, it is said to be overbought. If the Stochastic Oscillator is below 20, it is said to be oversold.
Are Overbought and Oversold Signals Reliable?
Overbought and oversold signals are not perfect. They will not always tell you exactly when to buy or sell a security. However, they can serve as valuable tools to help you decide on entering or exiting a trade.
It is important to remember that overbought and oversold signals should be just one part of your overall trading strategy. It isn’t wise to base your decision to buy or sell a security solely on an overbought or oversold signal. This is especially true for the crypto market, which is incredibly unpredictable and volatile and does not always follow conventional trading patterns.
There is no perfect time to buy or sell a security. Although overbought and oversold signals can help you make up your mind when to enter or exit a trade, they are not 100% reliable — after all, any signal can turn out to be false.
Some Tips on Using Overbought and Oversold Levels in Your Trading Strategy
Oversold and overbought signals can still benefit you even if you’re a beginner or don’t want to bother with complex indicators or trading terminals. For example, if Ethereum is said to be overbought at the moment, it means its price is close to reaching its maximum now. Basically, there are too many buyers, and the asset itself can’t support it. So, you can anticipate a bearish trend to emerge soon.
The opposite is also true. If an asset, for example, Bitcoin, is said to be oversold, that means a bull run may begin soon. Although these signals are not absolutely reliable, they can be a good and easily accessible indicator of the general attitude of the market.
The best way to trade with overbought and oversold levels, however, is to use several indicators and wait for a confirmation signal before entering a trade. For example, you could wait for the RSI to move out of the overbought or oversold territory or for the price to break out of the consolidation pattern.
Of course, that will probably mean you will get less profit than if you traded the asset right when you saw the signal — but you will also minimize your losses. At the end of the day, you should build your trading strategy based on your attitude towards risk and investment/trading as a whole.
FAQ
Is an overbought or an oversold signal better?
There is no right or wrong answer to this question. It depends on your trading strategy and what you are trying to achieve.
Should I buy when the RSI gives an oversold signal?
It depends. You should always wait for a confirmation signal before entering a trade.
What is the best overbought/oversold indicator?
There is no one best indicator. Choose the one that fits your trading strategy and investment goals, but also keep in mind that indicators work best in combination.
Disclaimer: Please note that the contents of this article are not financial or investing advice. The information provided in this article is the author’s opinion only and should not be considered as offering trading or investing recommendations. We do not make any warranties about the completeness, reliability and accuracy of this information. The cryptocurrency market suffers from high volatility and occasional arbitrary movements. Any investor, trader, or regular crypto users should research multiple viewpoints and be familiar with all local regulations before committing to an investment.

