beginner
There are a number of different chart patterns that traders have to watch out for to optimize their trading strategies. The bear flag pattern is one of them.
The bear flag is one of the most reliable continuation patterns and is often seen in downtrends. It is formed when there is a sharp sell-off followed by a period of consolidation. The objective of trading this pattern is to catch the next leg down in the trend.
In this article, we will discuss what the bear flag chart pattern looks like, how to identify it, and what trading strategies you can use when trading it.
Wanna see more content like this? Subscribe to Changelly’s newsletter to get weekly crypto news round-ups, price predictions, and information on the latest trends directly in your inbox!
Stay on top of crypto trends
Subscribe to our newsletter to get the latest crypto news in your inbox
Bear Flag Meaning
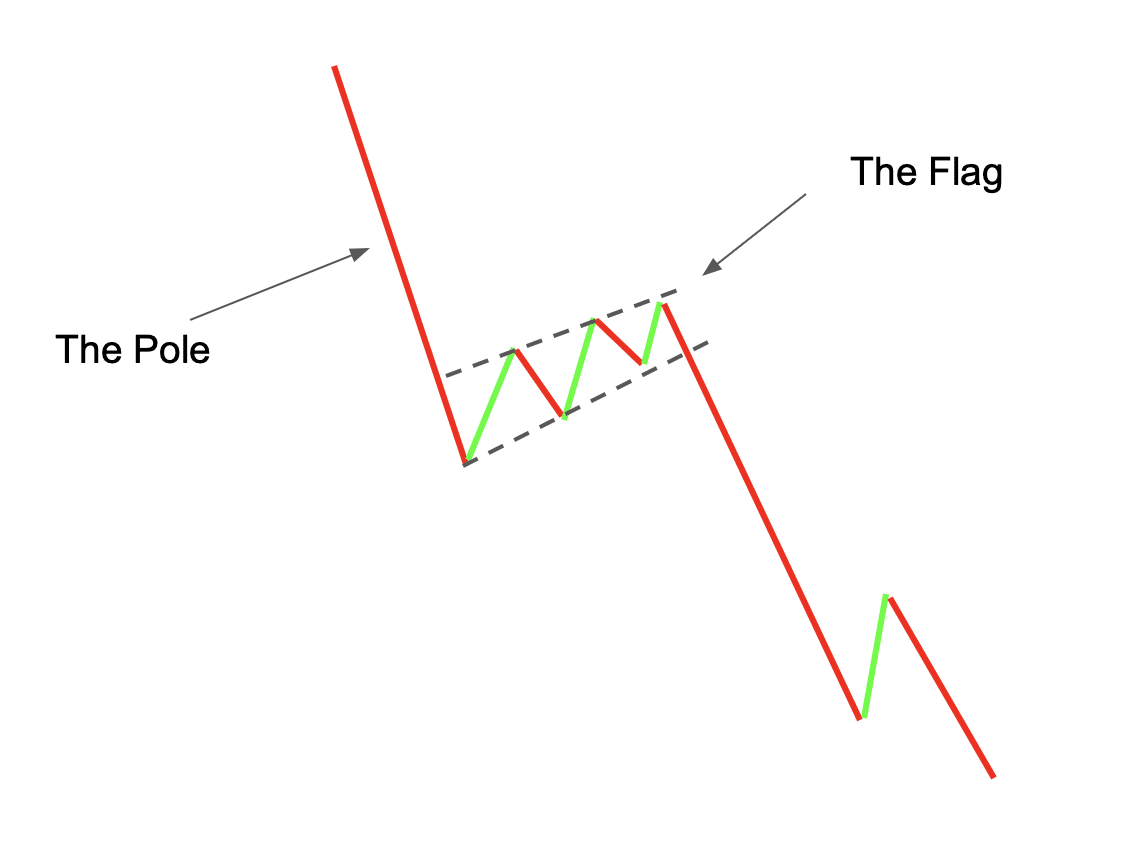
A bear flag is a technical analysis charting pattern used to predict the continuation of a bearish trend. The pattern is composed of two parts: the flag and the flagpole. The flagpole is formed by a sharp sell-off that takes place at the beginning of the pattern, and the flag is created by the period of consolidation that follows.
Bear flag patterns signal the continuation of a price decline.
How to Identify a Bear Flag Pattern?
Here’s what a typical bearish flag pattern looks like.

There are a few things you need to look for when trying to identify this pattern:
– First, you need to see a sharp sell-off in price. This sell-off should be accompanied by high volume, as this indicates that there is significant selling pressure in the market.
– After the sell-off, the price will enter into a period of consolidation. This is typically marked by lower volume and tighter trading range.
– Once you have identified these two parts of the pattern, you can then look for a breakout to the downside from the consolidation phase. This is typically signaled by a move below support or a forming bearish candlestick pattern.
The bear flag formation also has a bullish counterpart — the bull flag pattern. It has a similar structure but a different direction: bull flags signal a continuation of a rise in value instead.
How to Trade Crypto With a Bear Flag Pattern
There are a number of different trading strategies that you can use when trading bear flag patterns. One popular strategy is to wait for a breakout from the consolidation phase and then enter a short position. Another option is to buy puts or sell call options when the price breaks below support.
Regardless of which strategy you use, it is important to keep in mind that this pattern is best used in downtrends. This means that you should look for bearish signals before entering any trade. Also, be sure to place your stop loss above resistance so that you can protect your capital if the trade goes against you.
Bear Flag Pattern Strategy
Let’s take a look at an example of how you might trade a bear flag pattern.
Since bull and bear flag patterns represent that an asset is overbought or oversold, respectively, they’re often combined with various technical indicators, like the RSI.
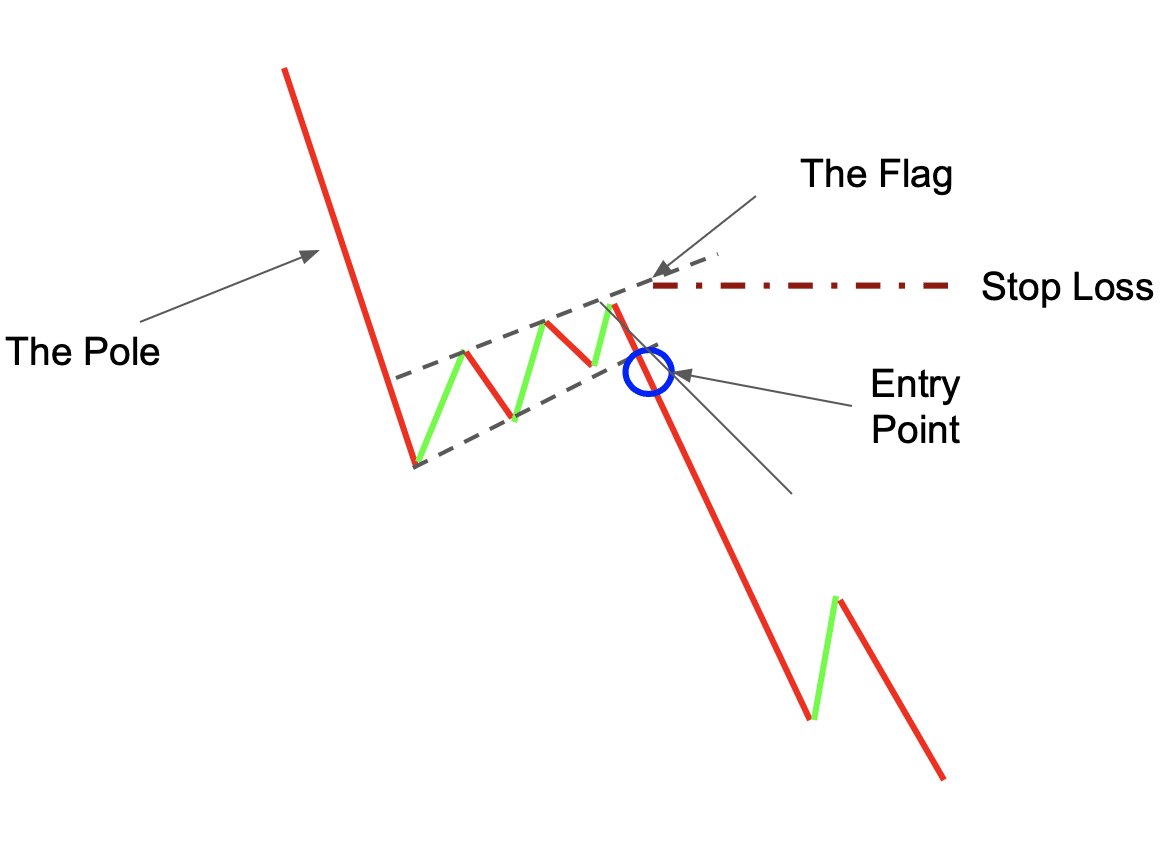
- To identify a bearish flag pattern, we first need to recognize the flagpole — the initial sharp sell-off. At the same time, we have to keep an eye on the volume — it needs to be high — and the RSI, which should be below 30.
- Next, we have to wait for the breakout from the consolidation phase. That means that you should place your short order as the “flag” zone of this chart pattern ends.
- Most traders usually place their trades on the candle that goes directly after the one that confirms the break of the pattern. The pattern is usually considered broken when the price goes below the support level — the flag’s lower border.
- Place a stop loss at a level that is comfortable for you. Most traders usually set it at the resistance level of the flag — its upper border.

Remember to use a combination of different technical indicators and market analysis techniques to confirm your trade signals before entering any positions. Also, always use risk management tools such as stop-loss orders to protect your capital.
Is Bear Flag a Reliable Indicator?
A bear flag pattern is a reliable indicator for predicting the continuation of a bearish trend. However, it is crucial to remember that this pattern is best used in downtrends. This means that you should look for bearish signals before entering any trade. Also, be sure to place your stop loss above resistance so that you can protect your capital if the trade goes against you.
Additionally, bear flag patterns should always be confirmed using other indicators, like the RSI.
Pros and Cons of the Bear Flag Pattern
Pros:
– A bear flag pattern is a reliable indicator for predicting the continuation of a bearish trend.
– It is useful for making profitable short trades.
Cons:
– Just like any other indicator, the bear flag can be unreliable.
– Investors who’d rather avoid risky trades will have limited opportunities to make a huge profit when using this chart pattern.
Final Thoughts
The bear flag pattern is one of the most popular price action patterns. It is used to predict the continuation of a bearish trend. It is a powerful tool, but just like any other element of technical analysis, it should not be used in isolation.
Cryptocurrency prices are unpredictable, and traders should always be mindful of extreme volatility when analyzing crypto market trends. Be careful and conscious of the market situation, and don’t get caught up in FOMO. And, of course, don’t forget to DYOR!
FAQ
Is the bear flag bullish?
No, the bear flag pattern is a bearish continuation pattern.
Is the bear flag bearish?
Yes, the bear flag pattern is a bearish continuation pattern.
How do you trade a bear flag?
The best way to trade a bear flag pattern is to look for bearish signals in downtrends. You can enter a short position when the price breaks below support or buy puts/sell calls when the price forms a bearish candlestick pattern.
What is an example of a bear flag chart pattern?
An example of a bear flag chart pattern can be seen in Ethereum (ETH) from mid-March to early April 2020. ETH formed a bearish flag pattern, having made a sharp sell-off from $200 to $160.
How reliable are bear flags?
A bear flag pattern is a reliable indicator for predicting the continuation of a bearish trend. However, it is not absolutely accurate and can sometimes be misleading, so it should be used in combination with other trading indicators.
How long does a bear flag last?
Bear flag patterns can last for days or even weeks. However, it is worth noting that the longer the consolidation phase lasts, the less reliable the pattern becomes. Therefore, it is best to enter trades when the consolidation phase is relatively short.
Disclaimer: Please note that the contents of this article are not financial or investing advice. The information provided in this article is the author’s opinion only and should not be considered as offering trading or investing recommendations. We do not make any warranties about the completeness, reliability and accuracy of this information. The cryptocurrency market suffers from high volatility and occasional arbitrary movements. Any investor, trader, or regular crypto users should research multiple viewpoints and be familiar with all local regulations before committing to an investment.

